Chart of the Day 7/30/25: Is it Time to Brace for Impact?
It’s been a heck of a ride in the stock market. But is it time to brace for impact? With something unexpected and potentially treacherous?
The MoneyShow Chart of the Day might clue you in as to why I’m asking. It’s a table showing S&P 500 Index (SPY) returns by month, courtesy of Topdown Charts.
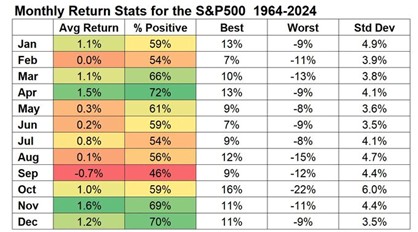
Source: Topdown Charts
Notice those red table cells in September? And the orange ones in August? That’s because the next two months are among the worst for the markets, historically speaking. In fact, September had the ONLY negative average return (-0.7%) in the 1964-2024 study period.
Yes, we’ve had some nasty moves in October. The market crashes in 1987 and 1929 easily come to mind – as does October 2008 during the Great Financial Crisis. But even that notorious month has shown positive returns 59% of the time – with an average gain of 1%.
I don’t know if August-September 2025 will buck the trend and turn out just fine...or if there are any below-the-waves obstacles lurking. But it couldn’t hurt to take some profits after the big rally we’ve had. Then you can park that money in cash to take advantage of potential bargains any volatility creates.
I wouldn’t call it bracing for impact. More like taking out some insurance!
If you want to get more articles and chart analysis from MoneyShow like this, subscribe to our Top Pros’ Top Picks newsletter here.